
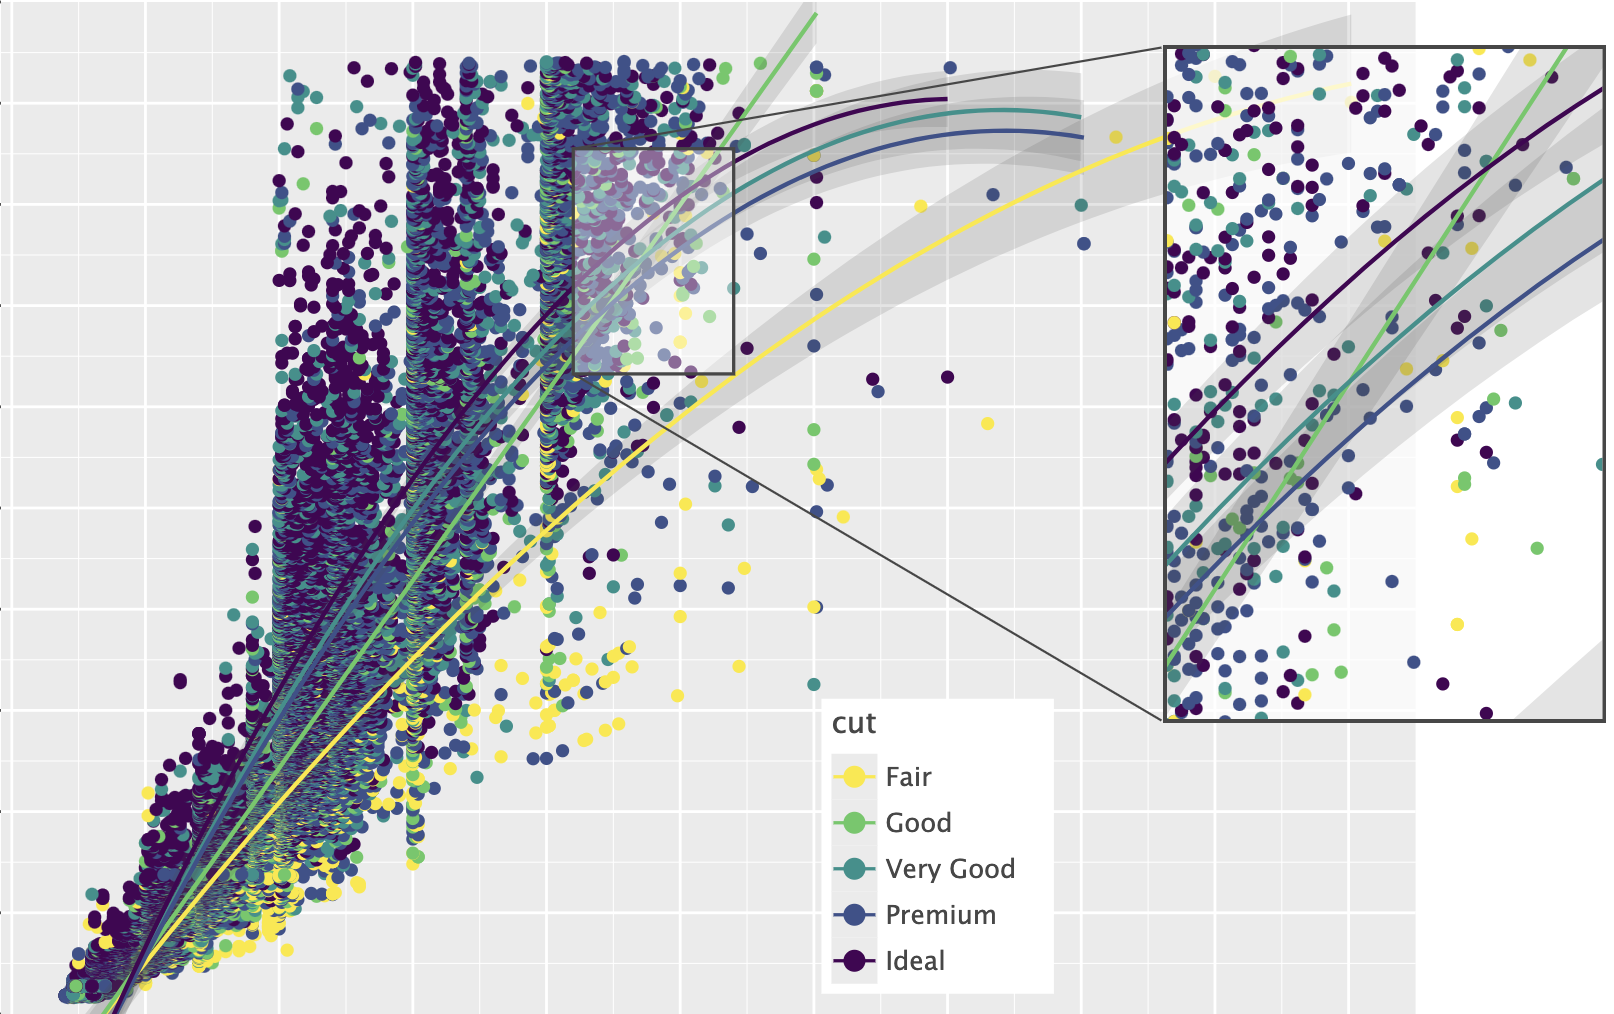
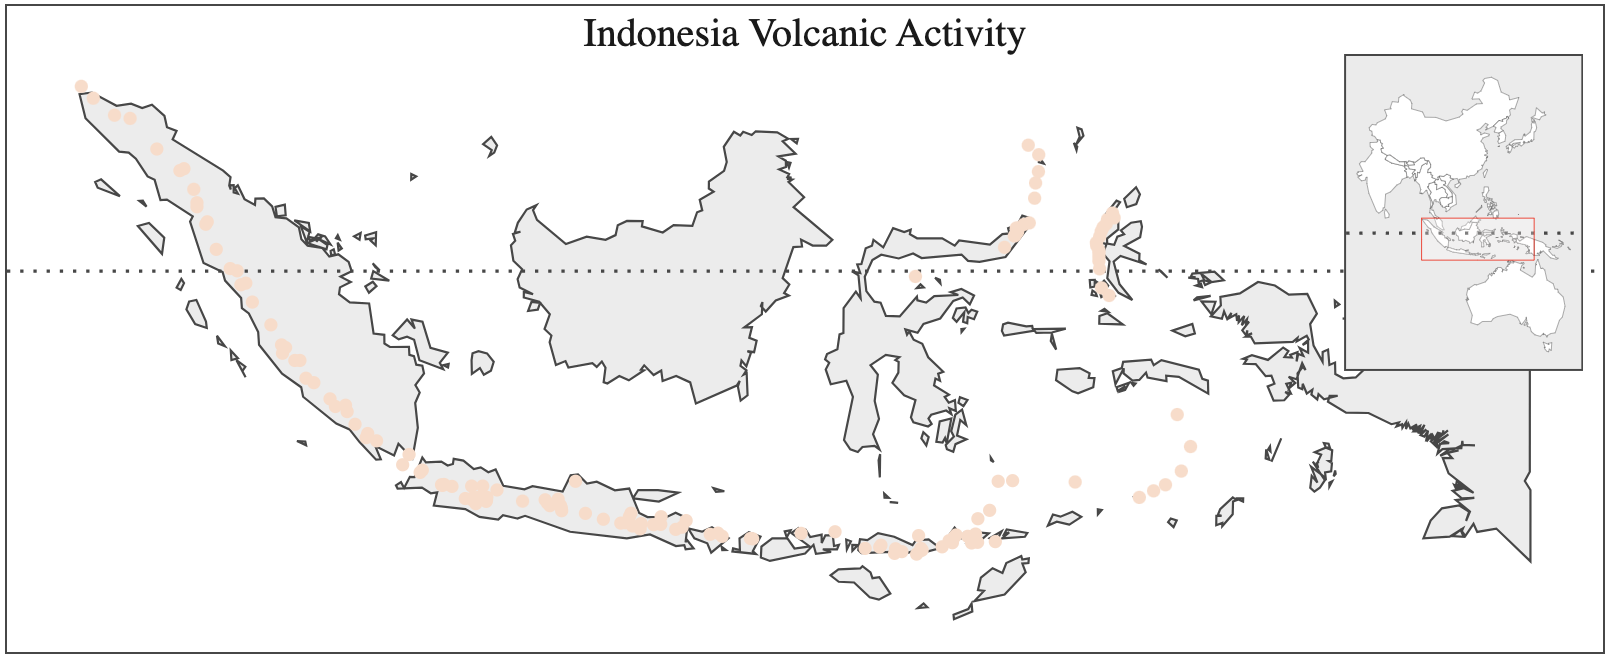
Multiplatform plotting library inspired by the Grammar of Graphics, enabling creation of customizable visualizations. Supports interactive plotting in various notebooks and embedding in applications. Features include polar coordinates, curve geometries, and advanced customization options.

Lets-Plot is a multiplatform plotting library built on the principles of the Grammar of Graphics.
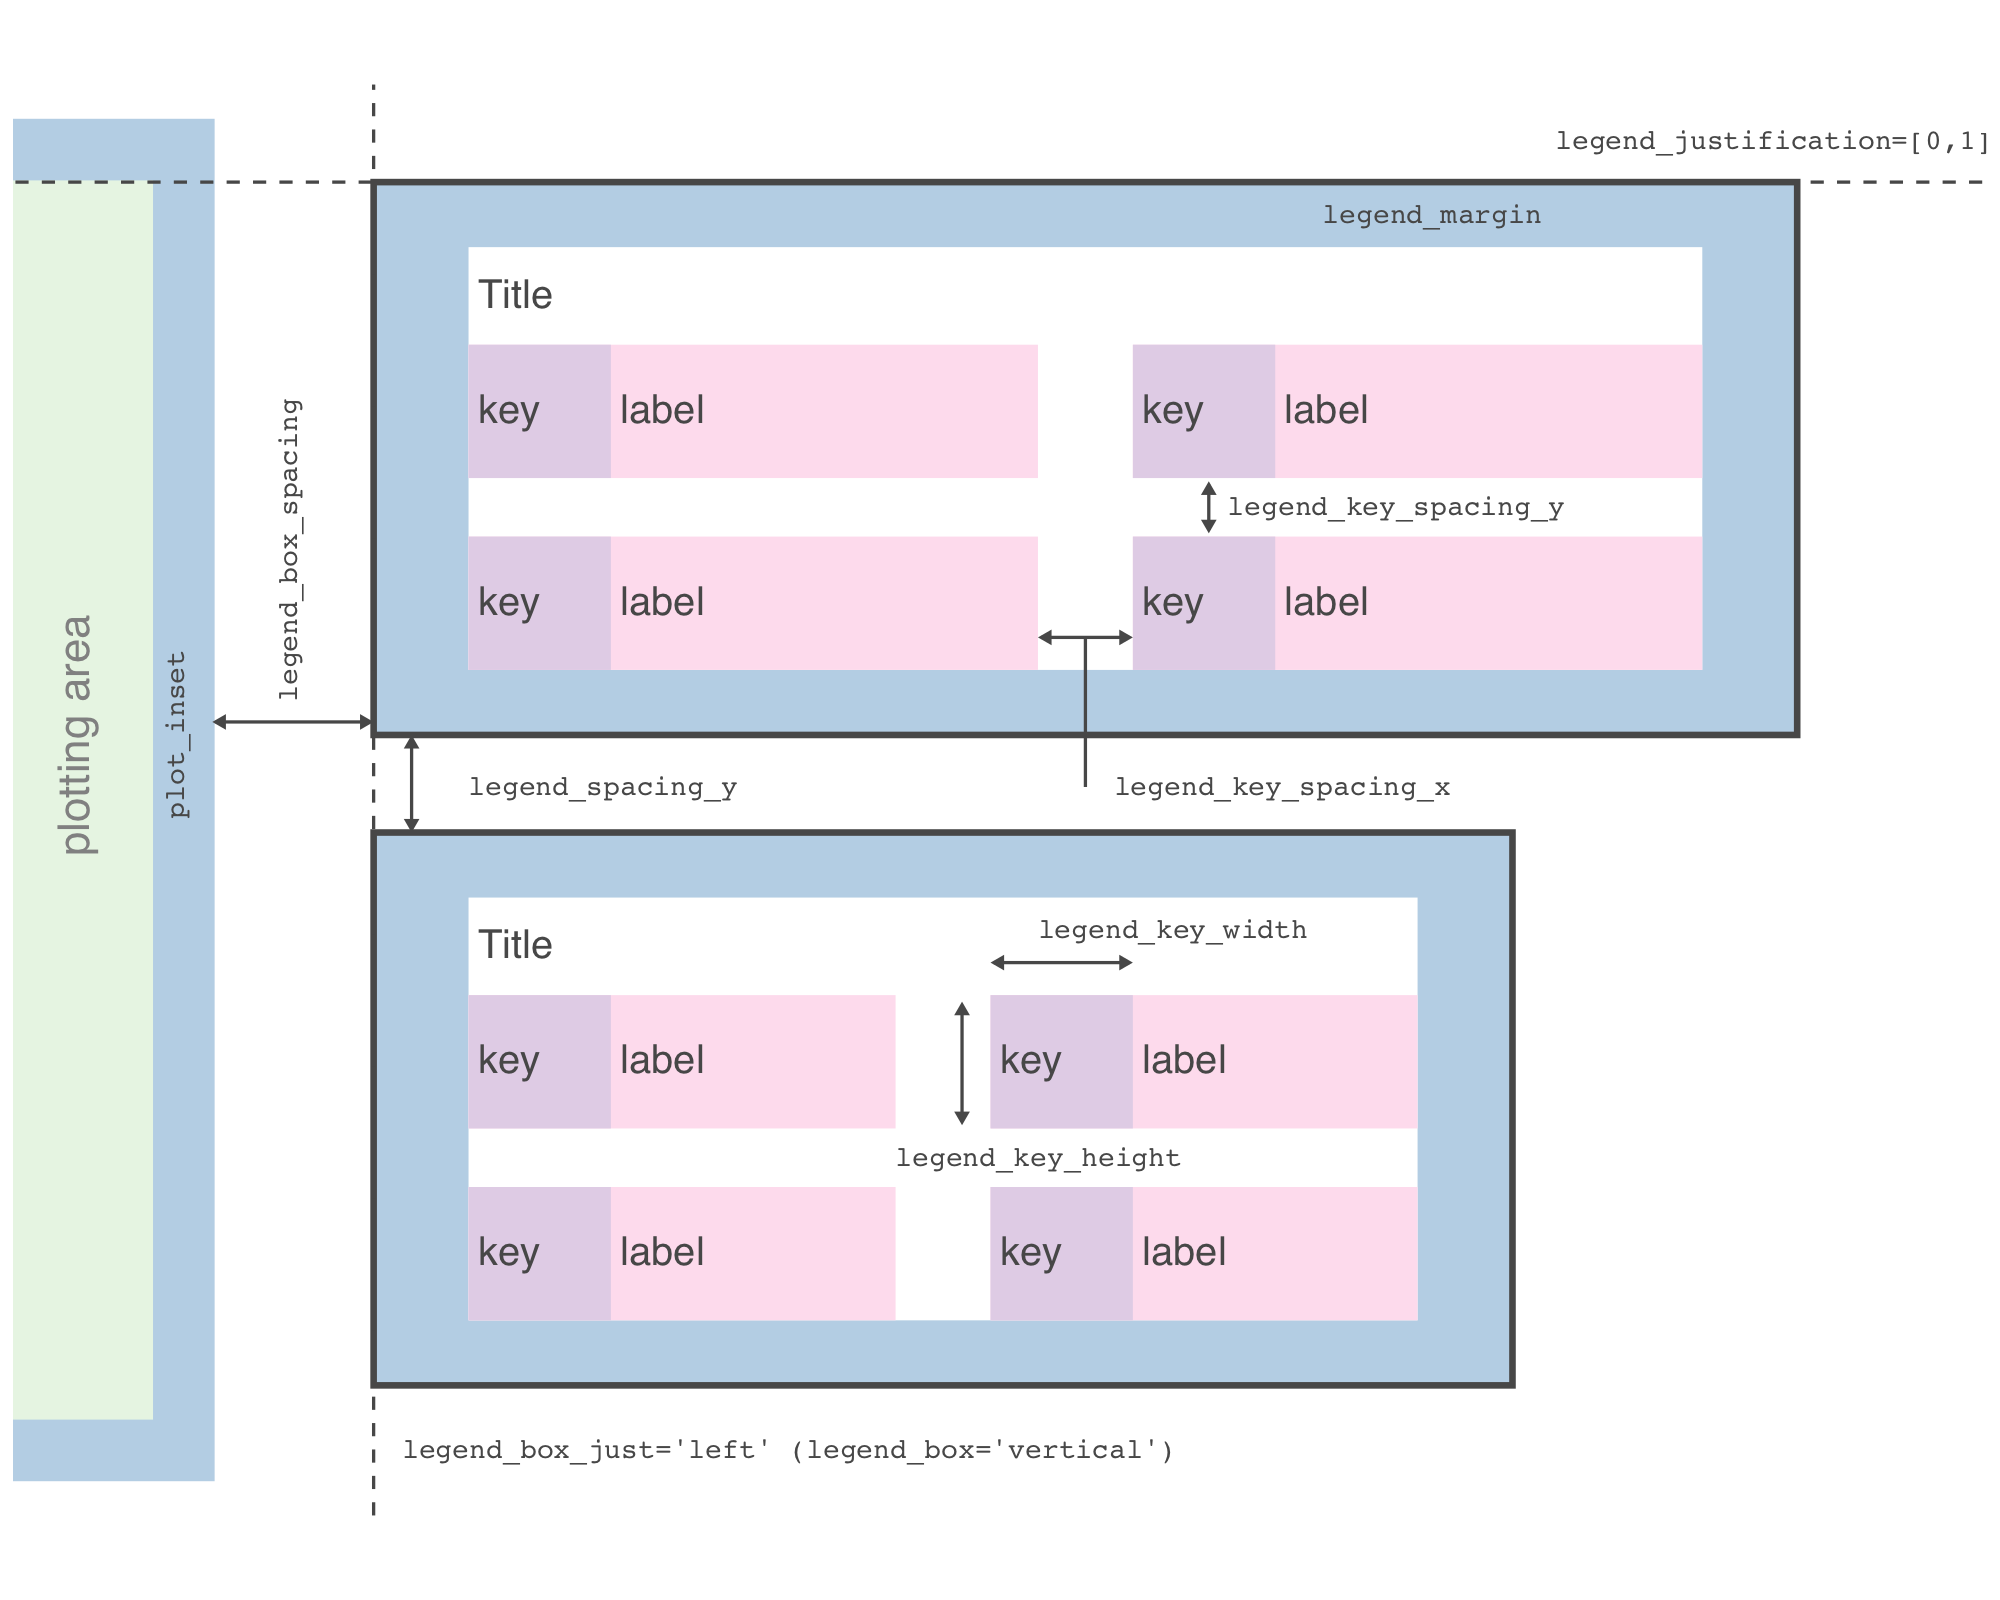
The library design is heavily influenced by Leland Wilkinson's work The Grammar of Graphics describing the deep features that underlie all statistical graphics.
This grammar [...] is made up of a set of independent components that can be composed in many different ways. This makes [it] very powerful because you are not limited to a set of pre-specified graphics, but you can create new graphics that are precisely tailored for your problem.
- Hadley Wickham, "ggplot2: Elegant Graphics for Data Analysis"
A bridge between R (ggplot2) and Python data visualization.
To learn more, see the documentation site at lets-plot.org/python.
Create plots in Kotlin Notebook,
Datalore, Jupyter with Kotlin Kernel
or any other notebook that supports Kotlin Kernel.
To learn more, see the Lets-Plot Kotlin API project at GitHub.
Embed Lets-Plot charts in Compose Multiplatform applications.
To learn more, see the Lets-Plot Compose Frontend project at GitHub.
Embed Lets-Plot charts in JVM (Swing, JavaFX) and Kotlin/JS applications.
To learn more, see the Lets-Plot Kotlin API project at GitHub.
Kotlin API documentation site: lets-plot.org/kotlin.

Scientific mode in PyCharm and in IntelliJ IDEA provides support for interactive scientific computing and data visualization.
Lets-Plot in SciView plugin adds support for interactive plotting to IntelliJ-based IDEs with the Scientific mode enabled.
Note: The Scientific mode is NOT available in communinty editions of JetBrains IDEs.
Also read:


This project and the corresponding community are governed by the JetBrains Open Source and Community Code of Conduct. Please make sure you read it.
Code and documentation released under the MIT license. Copyright © 2019-2026, JetBrains s.r.o.
Lets-Plot is a multiplatform plotting library built on the principles of the Grammar of Graphics.
The library design is heavily influenced by Leland Wilkinson's work The Grammar of Graphics describing the deep features that underlie all statistical graphics.
This grammar [...] is made up of a set of independent components that can be composed in many different ways. This makes [it] very powerful because you are not limited to a set of pre-specified graphics, but you can create new graphics that are precisely tailored for your problem.
- Hadley Wickham, "ggplot2: Elegant Graphics for Data Analysis"
A bridge between R (ggplot2) and Python data visualization.
To learn more, see the documentation site at lets-plot.org/python.
Create plots in Kotlin Notebook,
Datalore, Jupyter with Kotlin Kernel
or any other notebook that supports Kotlin Kernel.
To learn more, see the Lets-Plot Kotlin API project at GitHub.
Embed Lets-Plot charts in Compose Multiplatform applications.
To learn more, see the Lets-Plot Compose Frontend project at GitHub.
Embed Lets-Plot charts in JVM (Swing, JavaFX) and Kotlin/JS applications.
To learn more, see the Lets-Plot Kotlin API project at GitHub.
Kotlin API documentation site: lets-plot.org/kotlin.
Scientific mode in PyCharm and in IntelliJ IDEA provides support for interactive scientific computing and data visualization.
Lets-Plot in SciView plugin adds support for interactive plotting to IntelliJ-based IDEs with the Scientific mode enabled.
Note: The Scientific mode is NOT available in communinty editions of JetBrains IDEs.
Also read:
This project and the corresponding community are governed by the JetBrains Open Source and Community Code of Conduct. Please make sure you read it.
Code and documentation released under the MIT license. Copyright © 2019-2026, JetBrains s.r.o.


